Debugging SDK Processor Remotely using Java Debugger (introduced in v6.1.0)
Preparing Traffic Manager Container
Do not enable remote debugger in production or cloud environments, as it can open insecure ports. If you want to enable it, then enable it only in dev environments, i.e. on your local machine.
-
Set
allowRemoteDebuggertotrueintrafficmanagersubchart values oroverridesfile. We recommended usingoverridesfile. -
Tunnel the
trafficmanagerservice port for allowing connections to the Java Debugger(JDB) port depending on the value ofjdbserviceport intrafficmanagersubchart values.
kubectl port-forward svc/trafficmanager-svc <local port>:<jdbservice port>
In the above command:
-
localportis the port to which the JDB will connect. -
jdbservice portis the port exposed via the trafficmanager service
For example, kubectl port-forward svc/trafficmanager-svc 8001:8002
Prepare the IDE
The following example use the local port 8001. Replace the 8001 port in the below example with your local port.
Example
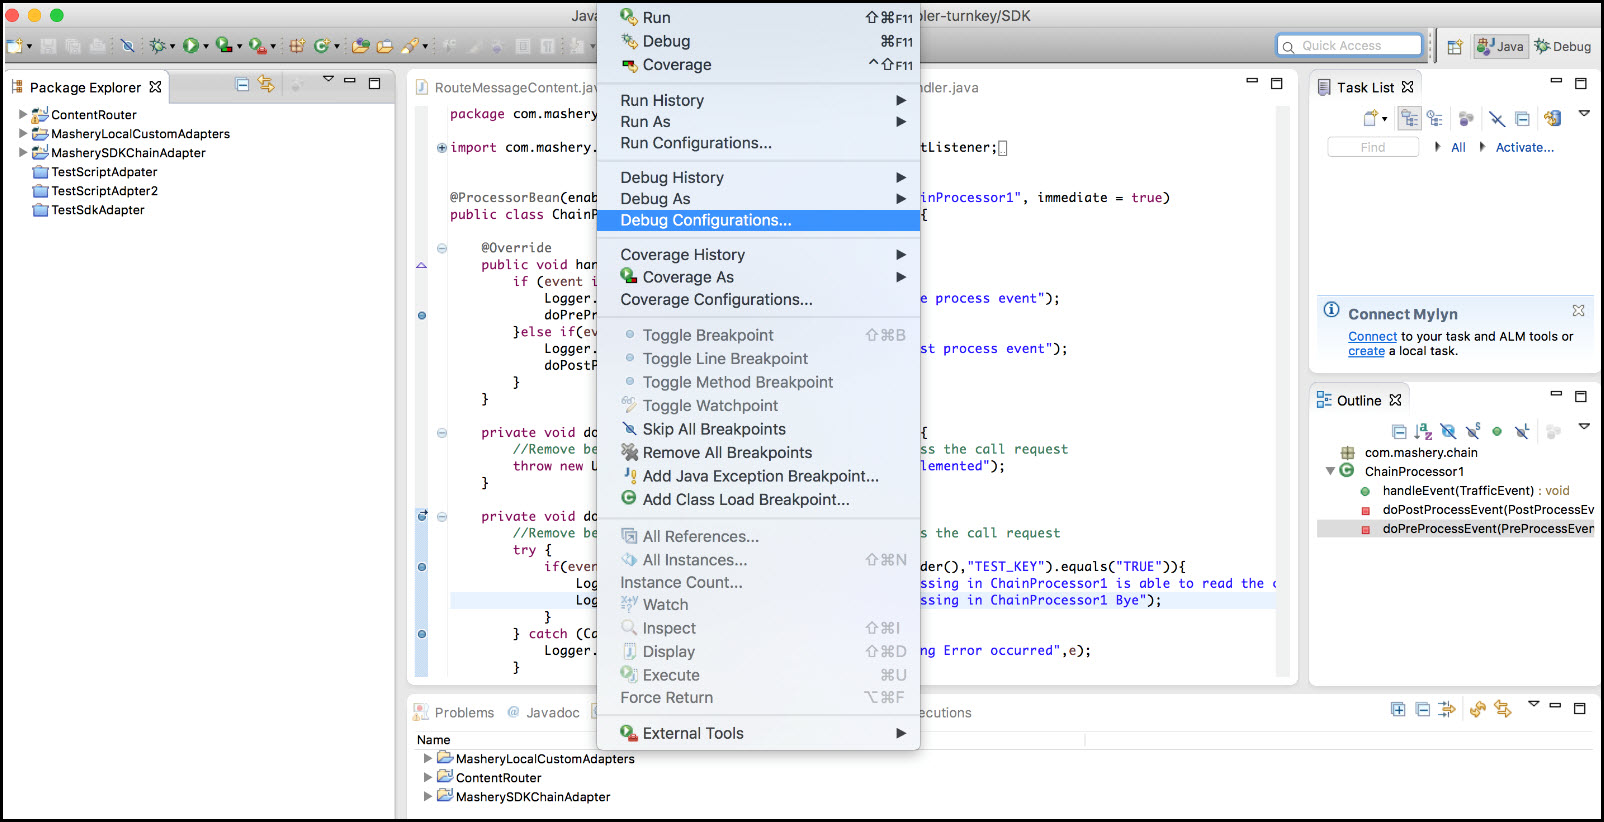
Eclipse
-
Open IDE and configure the debugger to connect to a remote port.
-
Click Debug Configurations. The Debug Configurations window opens.
-
Click Remote Java Application.
-
Click New button
 for creating a new configuration. The right side of the screen displays options.
 -
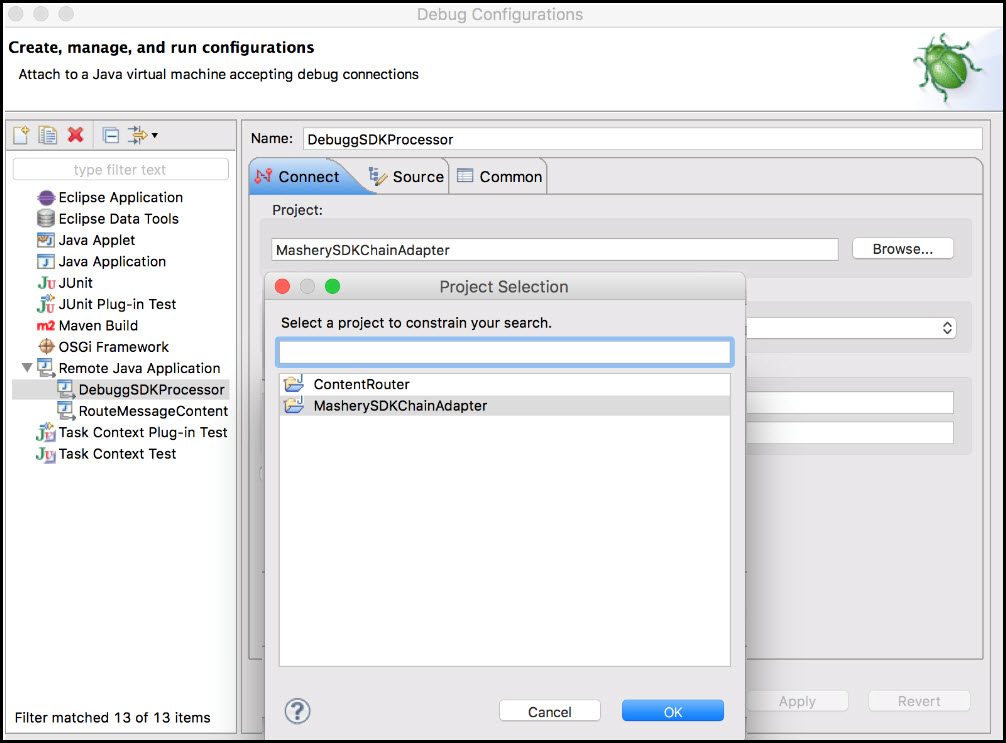
In the Connect tab, click Browse to select the Project. In the Project Selection window, select the SDK Processor's project.
-
In the Connection Properties, for Host, input the node's IP and for Port, input
8001. Click Apply and then click Debug.
IntelliJ Idea
-
From the main menu, click Run option and select Edit Configuration.
-
Click the
 button and select Remote from the configuration list.
 -
In the Run/Debug Configurations window, click SDK Debug in the tree structure and provide the following values:
-
In Debugger mode, select Attach to remote JVM.
-
In Host, enter the node's IP.
-
In Port, enter
8001.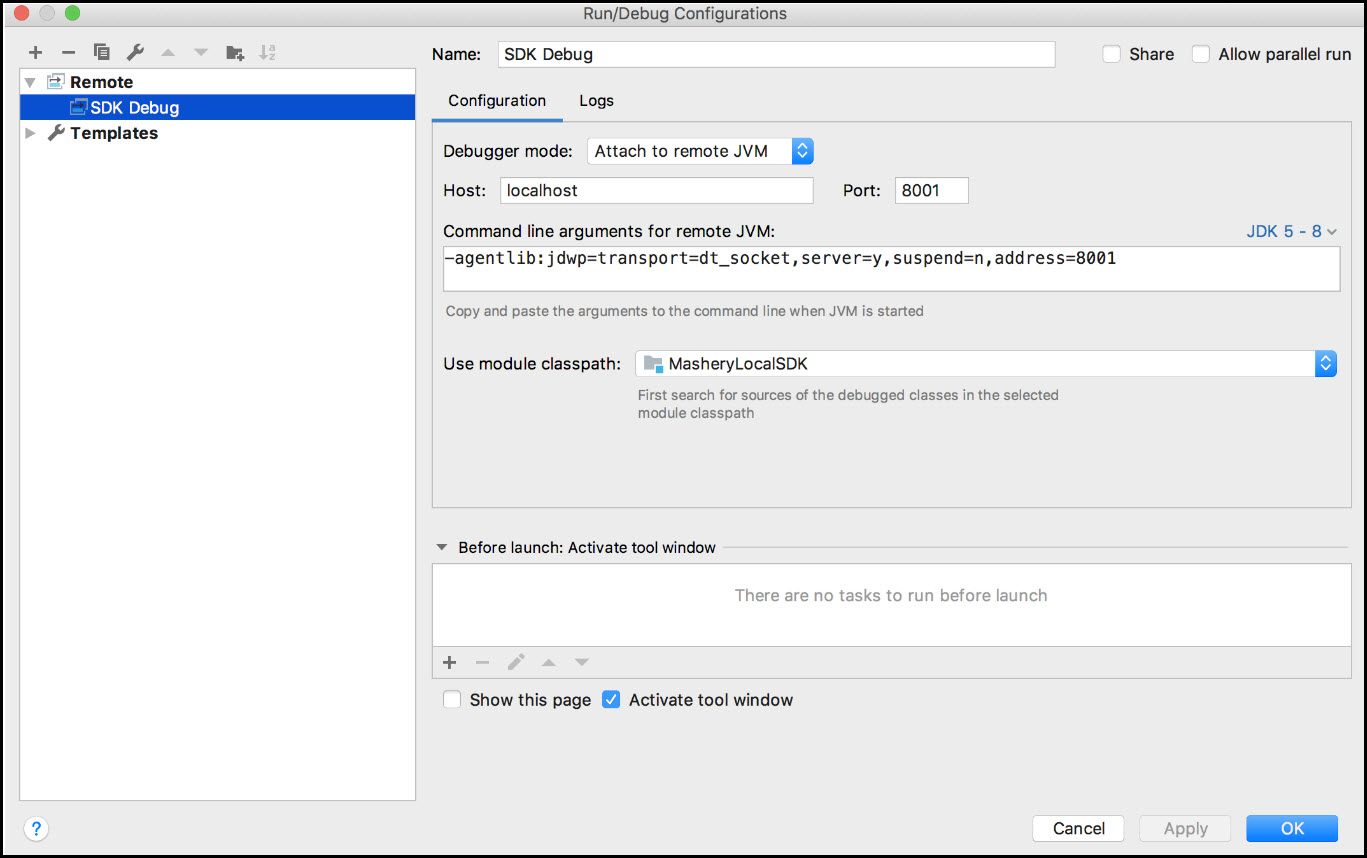
On successful completion, you can see the toolbar in the IntelliJ Idea window. Click the green debug icon to debug.

-
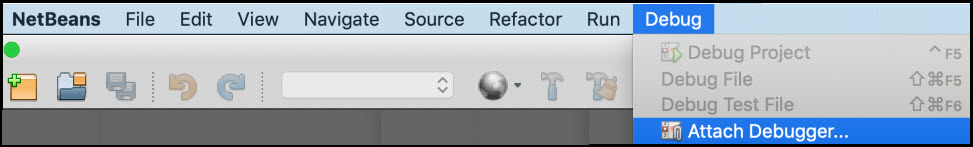
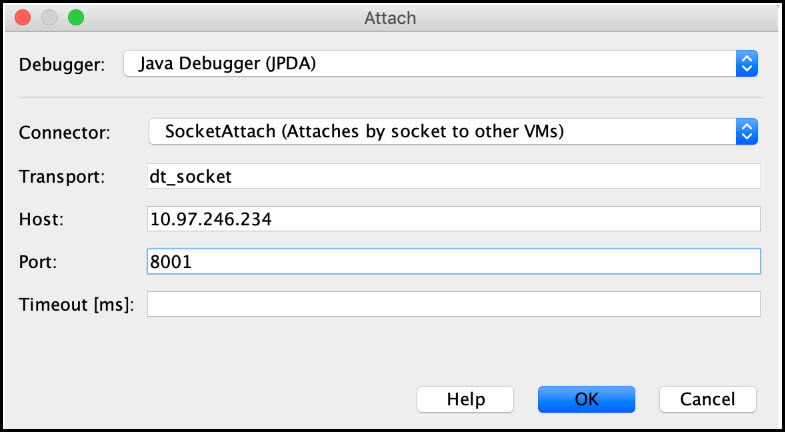
Apache NetBeans
-
In the NetBeans window, click Debug menu, and then click Attach Debugger. The Attach dialog box opens.
-
Provide the values in Debugger, Connector, and Transport fields.
-
For Host, input the node's IP and for Port, input
8001. -
Click OK. The debug view opens. Set the required breakpoints in the processor code and call an end point.
Fix, Build, Push, Deploy new or Upgrade
This section includes steps on how to fix the adapter code in case of issues in the application.
Fix
Fix the issues found on debugging by fixing the code.
Build Adapter
Build the adapter using SDK scripts. Run the built script.
$ cd <Mashery local SDK extract location>/MasheryLocalSDK
$ ./build-adapter.sh
Build and Push new Traffic Manager image
Build and push a new trafficmanager image.
- Copy the newly build adapter to assemblies.
cp <mashery local sdk extract location>/MasheryLocalSDK/dist/customer-extension.zip <APIML 6.1.0 extract location>/assemblies
- Verify if the new build is added to the correct location.
ls -lart <APIML 6.1.0 extract location>/assemblies
-
Check if the
customer-extension.zipfile has a new time stamp. -
Build only
trafficmanagerimage with a new tag.
cd <APIML 6.1.0 extract location>/. /build-images.sh -i apim-le-trafficmanager -s <new tag>
- Push the new image to the repository.
Deploy new or upgrade an existing application
If you are only upgrading the trafficmanager, use helm upgrade command instead of helm install command.
-
Change the tag for
trafficmanagerimage in theoverridesfile ortrafficmanagersubchart values or main values. We recommend usingoverridesfile. -
Upgrade the application.
helm upgrade <deployment name> <deployment folder> [optionally - list of overrides files]
